16 Vital KPIs To Measure Your Virtual Event Success

Share
With virtual events continuing to attract record numbers of sign-ups and attendance, it’s increasingly clear remote conferences and webinars are here to stay.
It’s been brilliant seeing marketers commit to a full calendar of good-looking events. But in the whirlwind of organising and hosting, sometimes analytics and ROI measurement gets lost.
So how do you accurately measure event marketing success?

Before you set any KPIs, first you need to understand why you’re running the event. Whether it’s to increase brand awareness, scoop up more qualified leads or boost web traffic.
Once you’re clear on the reasons behind running the event, you’ll be in a better position to analyse whether it’s achieved its purpose. Read on for our guide to measuring ROI and virtual event success.
1. Registration Page Conversion Rate
Comparing the number of registration page visits versus people who sign up is a good place to start to measure virtual event success.
To figure out how successful your registration page conversion rate is, first check the total number of visits to the web page. Then compare this to how many people actually went ahead and registered.
The difference is your conversion rate, and gives you an early taste of how successful your event will be.
2. Attendee Conversion Rate
Achieving lots of registrations is an obvious first step to event marketing success. However, the number of people who actually attend matters much more as an event success metric than the initial number of registrations.
To find out your attendee conversion rate, simply compare the number of registrations versus how many people log on.
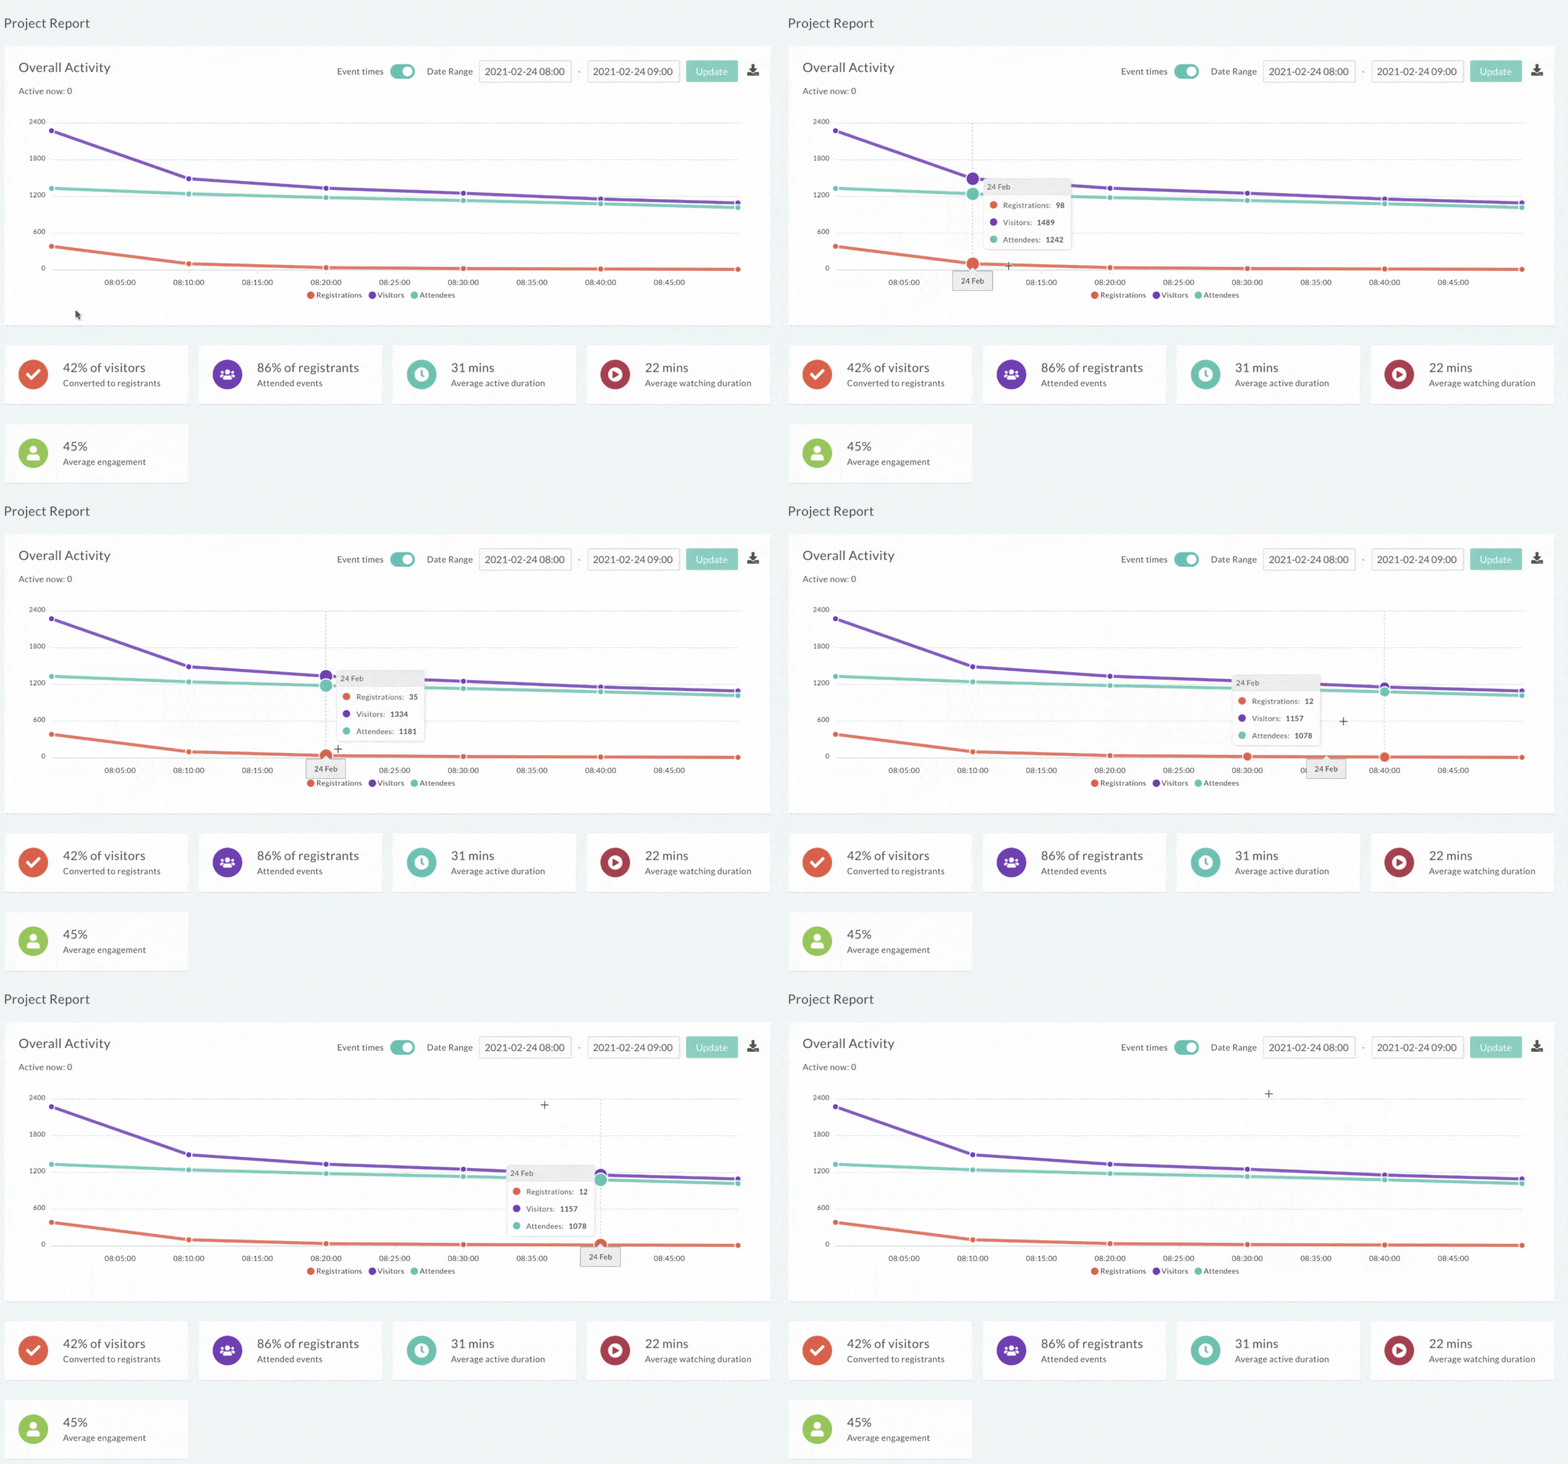
You should see this info on the dashboard of your virtual event platform. Below is an example dashboard from our platform at streamGo that houses a number of breakdown stats on your attendees, such as;
Visitor to registration percentage
Registration to attendee percentage
Average watching duration
Engagement rate percentage (more on this further down…)

If you’re running an all-day or multi-day event, you can also break down conversion rates by session. This way, you can understand which particular sessions were the most and least popular.
By tracking these numbers for every event you do, you’ll soon be able to establish a benchmark and keep an eye on changes as you cycle through your event calendar.
If your attendee conversion rate is less than 35%, perhaps take stock and see if you can work out why so many are dropping off between registration and attendance.
3. Audience Retention Rate
Your audience retention rate means both how many attendees are returning to your events, and how long they’re staying active and engaged throughout any single event.
If we’re going to be brutally honest here, unless your audience is engaged, your event can’t be judged a success. Sorry.
On the plus side, there are lots of things you can do to ramp up engagement, which should then lead to better retention.
Things like gamification, quizzes and polls all help. They’ll provide you with measurable outcomes, too.
If you use a virtual event platform like ours that can house all these different types of engagement features, as well as track how your audience interact on your event, then you’re winning.
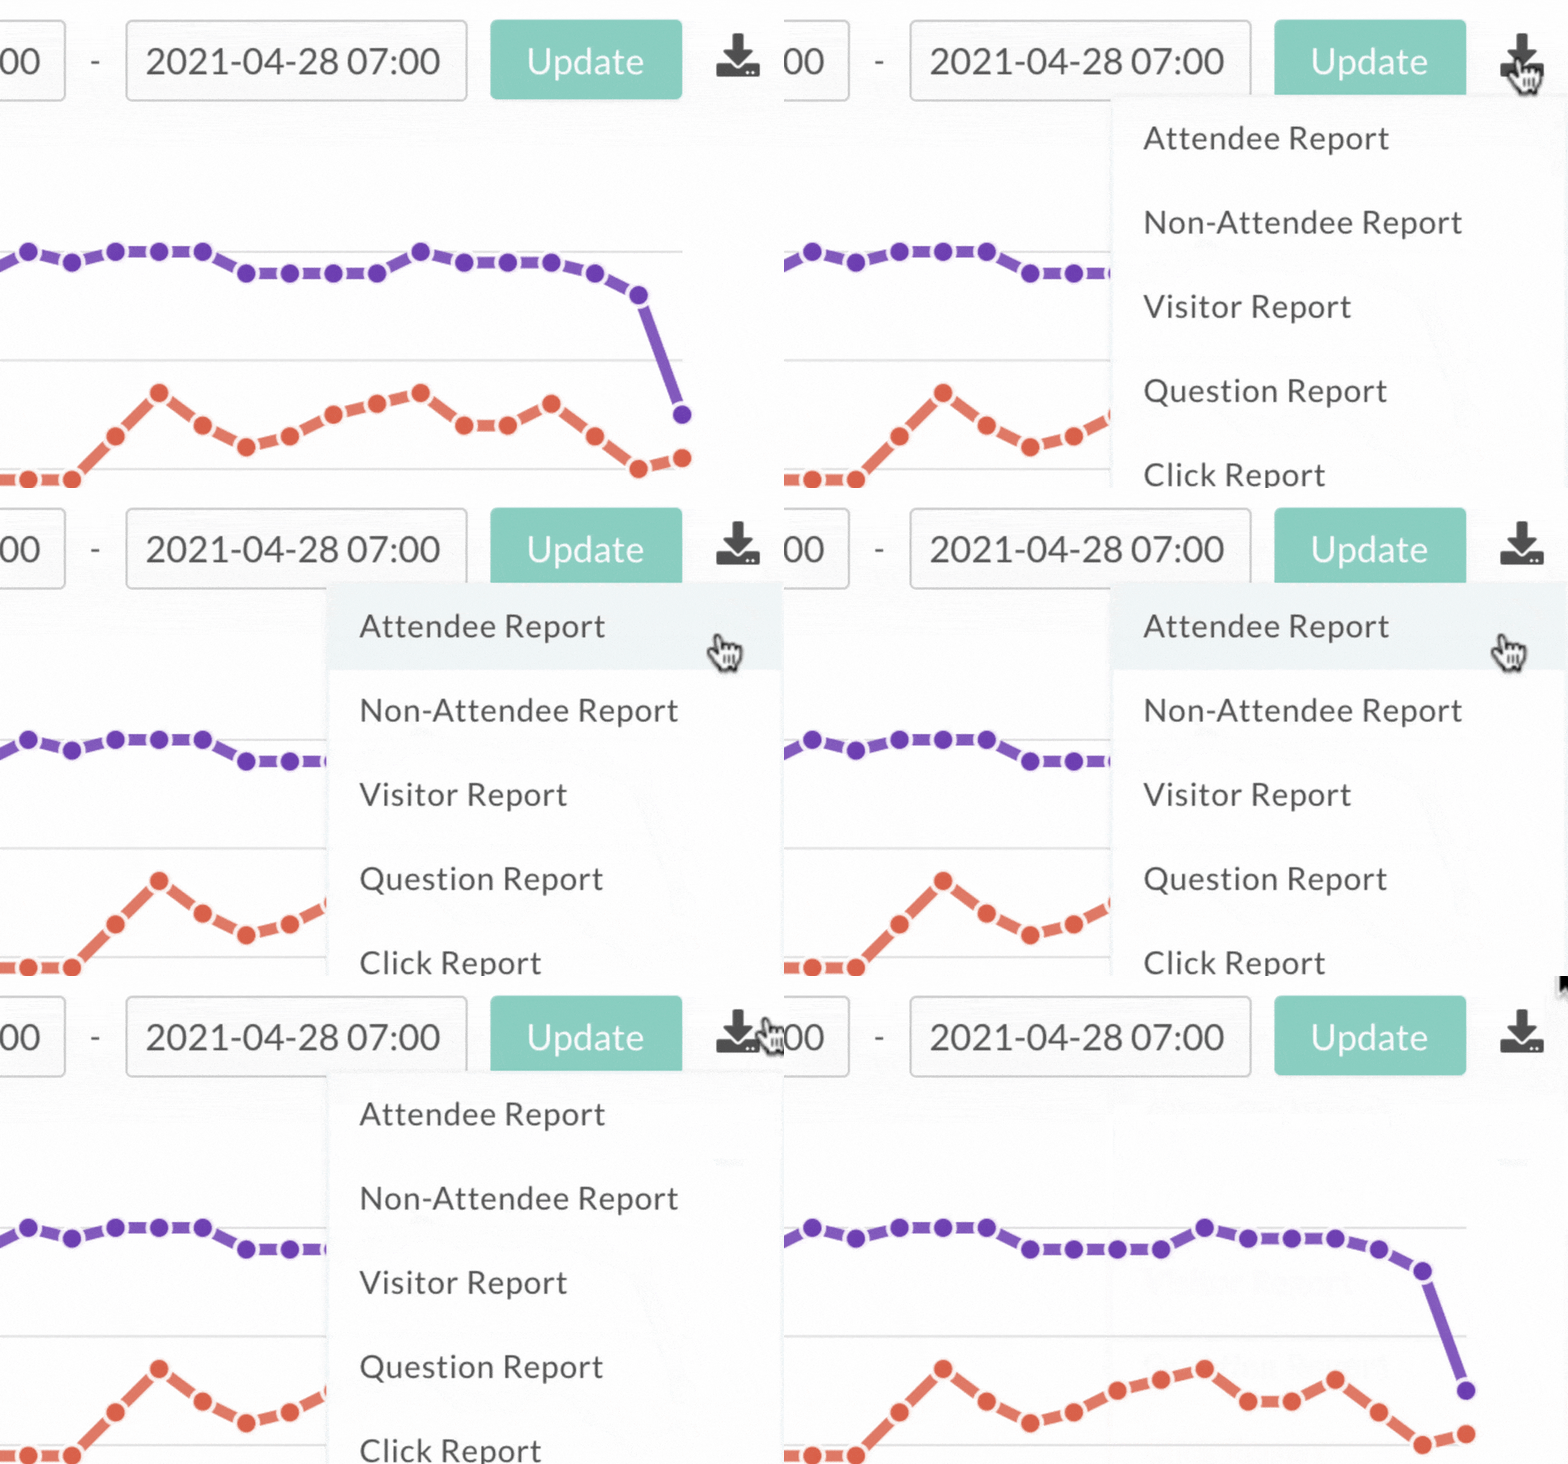
There are a number of attendee reports you can download from our platform that will give you a breakdown of these types of stats, including;
How long your audience were watching for
How many questions they asked
What URL they entered the event on
Where they came from (e.g email, social media, landing page)

We can even track who’s actively engaging with your event versus who just has it open on a background tab. This allows you to see who’s really paying attention…
4. Content Views & Downloads
Speaking of engagement, another effective way to measure virtual event success is checking how many people are viewing and downloading your content.
With so many of us interacting almost exclusively online, consider setting up a content hub. Your webinar could then act as a gateway, encouraging attendees to access more of your content. Inbound marketing at its finest.
Check you can also track common dropout sessions to understand areas of your event that may need more work because they’re not engaging enough.
Our platform will track specific content interactions, including clicks and downloads. You’ll soon learn which content is most successful at engaging your audience.
We’ll even give your attendees an engagement score, which is based on a number of things, including length of watching time and how many questions or polls they submitted.
Target More Leads with Video Search
What if we told you that you could use your event like a search engine and track exactly what your audience is searching for?
Our video search feature makes your on-demand event content searchable. Viewers just search for a keyword, phrase or tag to see relevant results, and click to play a video from that exact point.
Not only does this make it easy for your audience to find the content they’re most interested in, but it’s the perfect way to measure which topics are popular and who out of your audience members is actively engaged to help you generate more leads.
Any searches will be recorded in our platform, so you can use this data to really personalise your sales and marketing messages to them.
5. Poll Response Rate
Polls are a brilliant way to keep people actively engaged with your content; their answers also give you a direct insight into their opinions and feelings about the event topic at hand.
Most importantly, response rates for live polls are an excellent event metric to measure virtual event success. The more responses the better, as this suggests your audience are actively engaged in the discussion.
You can also break your response rate data down by session to see which sessions achieved the highest number of poll responses. You can then analyse why some did better than others to improve future polls.
6. Number of Questions
Just about every webinar and conference worth its salt will include a Q&A session. Ideal in helping you measure virtual event success, you’ll be able to tell how well things have gone by looking at the number of questions attendees asked.
Tally them up and compare the numbers to individual sessions and previous events. The more people actively participating, the more likely it is your attendees are highly engaged and interested in what your speakers have to say.
7. Audience Reactions
Another great event metric to gauge virtual event success is to look at audience reactions. A platform like streamGo’s means sessions come complete with social media style reaction icons. Here’s an example of them in action:

Much like the major social media channels, people can react live, hopefully giving your speaker a thumbs up as the action unfolds.
Clearly the more reactions you get, the more you can be confident that your audience is engaged. And as we keep saying, the more they’re engaged the more successful you can consider your event.
8. Sponsorship Revenue
Sponsorship revenue is a popular way to offset the cost of putting on an event. It can also be effective at raising revenue, forming a valuable income stream.
Before the event, agree with your management team how much revenue you want or need to make from sponsorships. With a target in sight, you’ll soon know how successful your event is depending whether you meet or exceed it.
If you’re hosting a sponsor booth, you can also use the same engagement metrics we’ve mentioned above. The number of content downloads and questions asked will tell you how interested people are in your sponsors.
If your sponsors generate plenty of interest and revenue at your event, pat yourself on the back: you’re a clear event marketing success story.
9. Referral Traffic Breakdown
Understanding where your sign-ups have come from is also a great gauge of event marketing success. For instance, if you’re running a LinkedIn campaign, how many leads are you seeing from that particular platform?
By breaking down referral traffic, you can then harness this data to inform how you run future event campaigns.
If LinkedIn turns out to be more successful at attracting leads than email (or vice versa), next time you know where to focus your efforts.
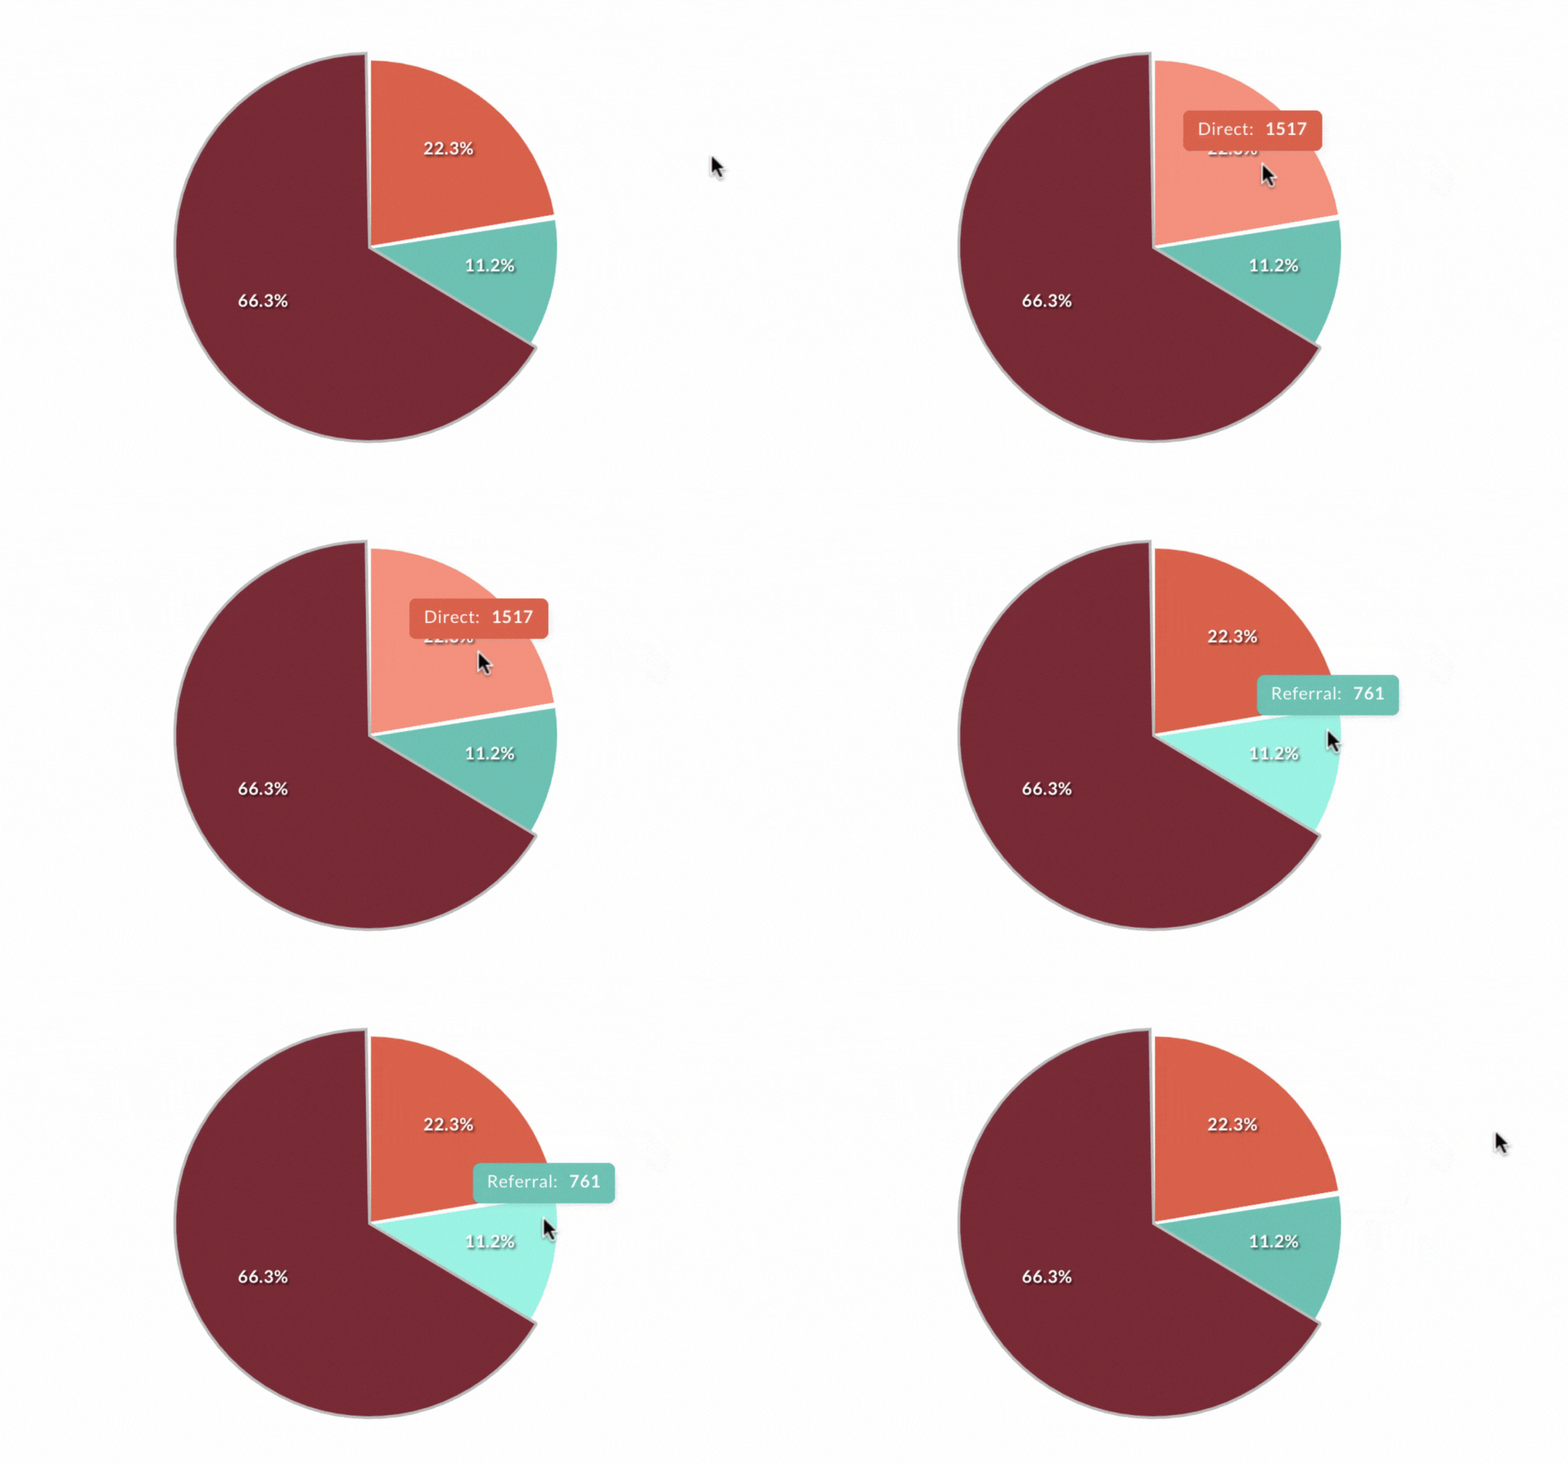
You can also effectively use this data to form your follow-up campaigns. Here’s an example of the interactive pie-chart you’ll be presented with at streamGo showing your referral traffic…

10. On-Demand Views
Just because your event has been and gone, it doesn’t mean your audience has disappeared with it. Far from it.
In fact, live viewing is only part of the story, as webinars and conferences increasingly function in a similar way to on-demand TV. Indeed, research has shown that at least 20% of attendees will watch events on-demand rather than live.
By pushing on-demand sign-ups and views, you’re tapping into valuable lead-gen opportunities.
And tracking the number of on-demand views and sign-ups you get is another vital way to measure event success.
11. Number of Quality Leads
Totting up the number of quality leads your event attracts will soon tell you whether you can label it a success or not. Especially if one of the key reasons behind your event is to generate leads.
Before your event takes place, make sure you’re clear on the criteria your company uses to decide what a quality lead actually is. People with particular job titles from particular sectors, for example.
Check if your target market or ideal personas are signing up. Are they submitting any of your forms throughout the event? Are they engaged and interested in learning more? If so, you can sit back and drink in all that sweet event marketing success.
12. Number of Deals Created & Closed
Let’s face it: all for-profit companies exist ultimately to make deals and increase their revenue. So with any luck, all those quality leads your event has attracted will lead to a decent number of deals created and closed.
Once your event has finished, monitor how many deals your sales team created and then closed from the leads you handed to them. The more you make, the bigger your event’s success factor.
13. Return on Investment
We don’t put events on purely for the joy of it – as fun and entertaining as they may be. Like anything, we invest to get something back. So tracking your event’s ROI is a given.
With deals struck counting towards your event’s overall ROI, you’ll also want to calculate other sources of revenue. Things like ticket sales will be a major contributor, as will sponsorship revenue.
You should be able to check these figures easily enough on your virtual event platform dashboard.

14. Audience Satisfaction
Given how important audience engagement is to running a successful event, asking for feedback is the next logical step to measuring how well everything went down.
Because it’s personal and based on actual experience, post-session and post-event feedback are among the best ways to assess whether your event matched (or even surpassed) expectations.
Analysing survey responses and Net Promoter Scores will also give you valuable insights to help improve performance for upcoming sessions and future events.

Be sure to ask questions such as: how likely are you to recommend the event to a friend or colleague? How likely are you to attend another event organised by [company]? What could we improve for our next event?
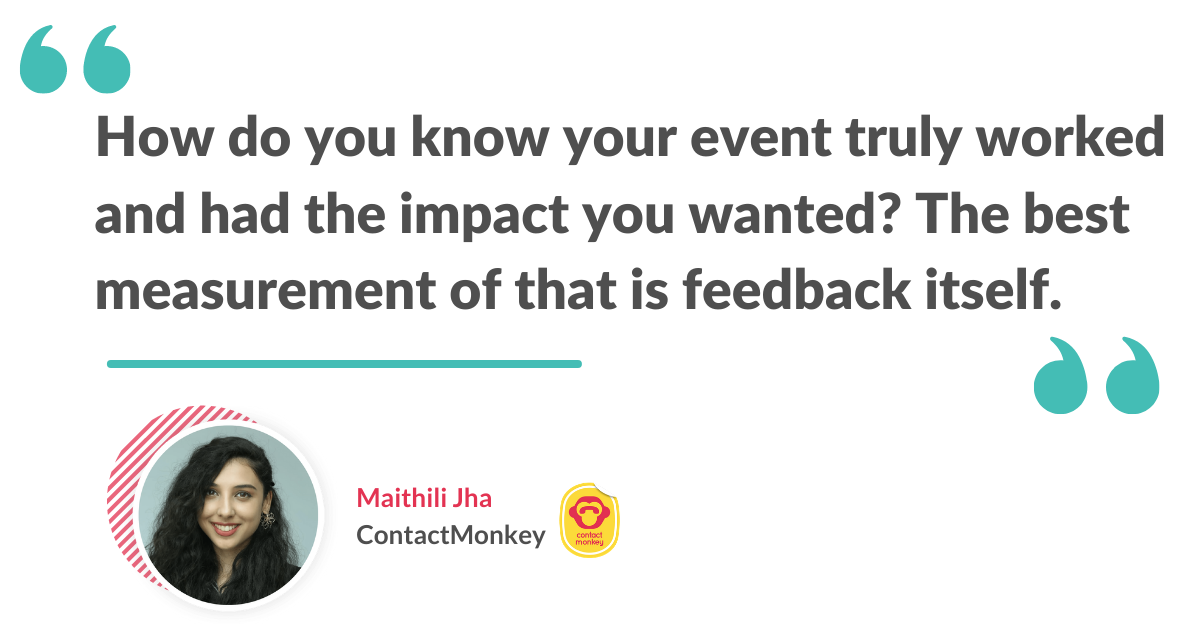
Maithili Jha, Digital Marketing Manager at ContactMonkey explains the importance of getting that employee feedback to determine your event success during our joint webinar. You can read more here.
15. Social Media Engagement
Social media metrics are another must when measuring the success of your virtual event. How many people are liking, sharing and commenting on your event posts? If you’re posting videos, what is the watch time; how many views do posts get?
You’ll also want to track the number of hashtag mentions, if you’ve created a specific event hashtag.
And like the type of leads you’re generating, it’s always good to check the quality of social media mentions rather than just looking at quantity. Social listening tools can help you decide whether your virtual event was a success based on how positive each mention is.
You could also check whether your social media following has increased in the weeks before and after your event. This would suggest you’ve boosted brand awareness and brand equity – both signs your event has made a strong impression on your target audience.
16. Email Campaign Performance
Last but not least, you’ll want to monitor email open rates, unsubscribes and click-throughs to your registration page. These are key early indicators of how successful your virtual event will be.
An event marketing add-on in your virtual event platform will give you all the data you need to understand how much interest your event is drumming up. It will also enable you to build better email campaigns in future.
According to Eventbrite, you can expect around 26% of recipients to open event invitations – higher than the average email open rate of 21%. Don’t be too disappointed but you should only expect about 5% to click through, and 1% to unsubscribe.
With this in mind, getting potential attendees just to open your email means you’ve done something right.
Summary
Clearly, there is more than one way to measure ROI. And while data might not be a magic bullet to predicting stonking virtual event success, it certainly helps.
Start with what you’d like your event to accomplish. It’ll then be much easier to measure success by tracking whether or not you’ve met your targets.
Of course, you’ll rightly be focused on making the content and style as riveting and relevant as possible. But it’s always worth checking you’ve got the tools in place to track sign-ups, retention, engagement, leads, deals and email opens.
Hopefully we’ve given you plenty to mull over for your next conference or webinar. If you’re about to start marketing an event, check out our guide to creating a stand-out event registration email.
Inspired for your next online event?
See the streamGo platform in action!


