Smarter Event Decisions Start Here: Inside streamGo’s Reporting Suite
Share
When it comes to webinars and virtual events, the real magic doesn’t stop when the stream ends, it starts with what you do next. If you're still relying on simple metrics like “number of attendees” or “time watched,” you’re missing out on a treasure trove of insights that could transform your event strategy. That’s where streamGo’s comprehensive reporting suite steps in. We built our analytics tools to help you make smarter event decisions at every stage of the funnel.
The Problem With Traditional Event Reporting
Let’s face it, most event platforms treat reporting as an afterthought. You're lucky if you get a CSV file with some basic viewer stats. There’s rarely any context, no meaningful way to connect the dots, and definitely no automated and free integration with your existing systems.
And while attendance numbers look nice on a post-event slide, they don’t tell you:
Who was actually engaged and by how much?
Which content resonated with your audience?
How your event impacted lead generation or ROI?
That’s where we’re different.
Introducing streamGo’s Reporting Suite
Our reporting functionality goes way beyond vanity metrics. It’s designed to surface actionable insights and power smarter decisions across marketing, sales, and content teams. Here’s a breakdown of what you get.
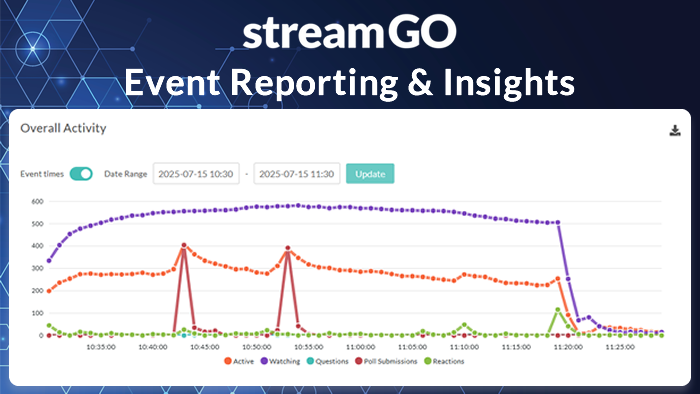
🔍 Live & On-Demand Engagement Analytics
From the moment your event starts, streamGo tracks:
Q&A submissions
Poll and survey participation
Chat and search activity
CTA clicks and downloads
Reactions and emoji feedback
Audience drop-off points
Referral, location and device data
Full user journeys
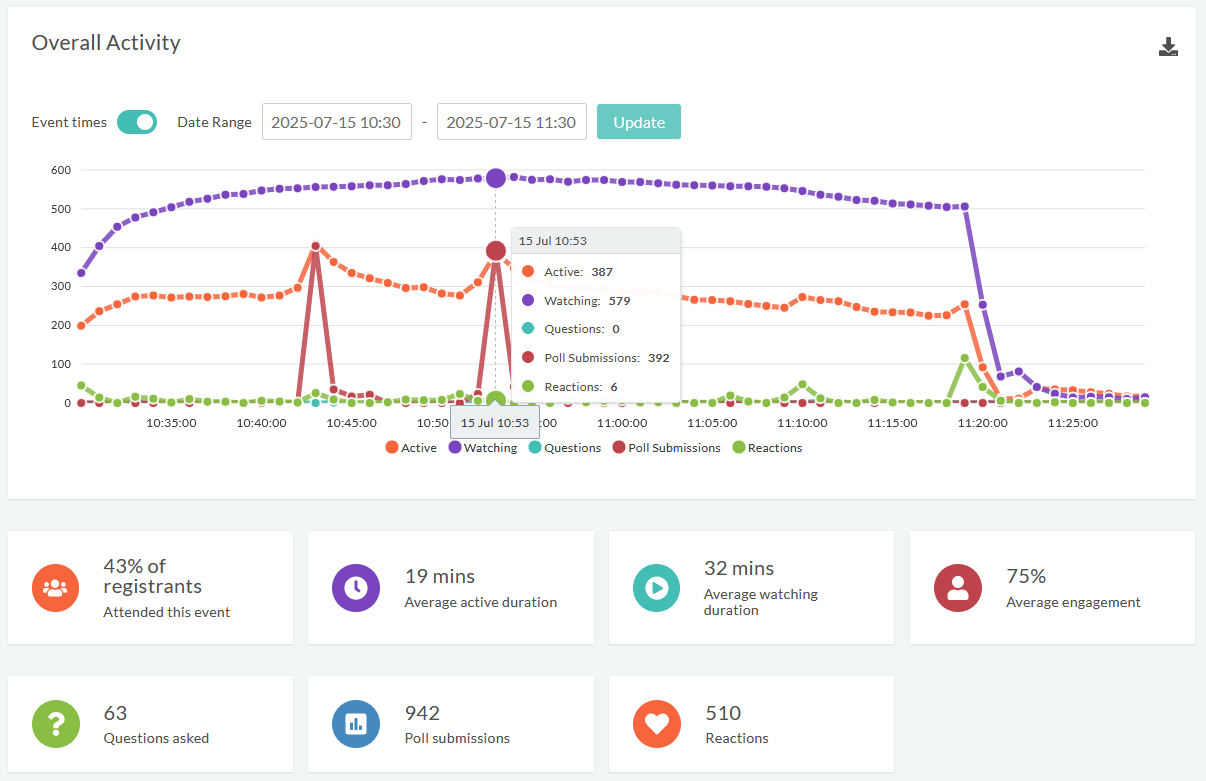
You’ll know not just who attended, but who was actively engaged, and for how long, segmented by event type.
🤖 AI-Powered Post-Event Insights
Once your event ends, we automatically generate a detailed insights email powered by generative AI. Within minutes, you’ll receive:
A summary of your session’s key content
Speaker highlights and notable quotes
Common audience questions
Attendance and engagement stats
Poll data visualised into clear charts
Perfect for crafting follow-up campaigns, sales outreach, or reporting to internal stakeholders.
🧭 Chapter & Content Interaction Reporting
Thanks to our AI-generated video chapters, you can now see:
Which topics viewers skipped to
Which chapters had high engagement (or high drop-off)
How many attendees viewed 75% or more of a section
It’s like heat-mapping for your webinar content.
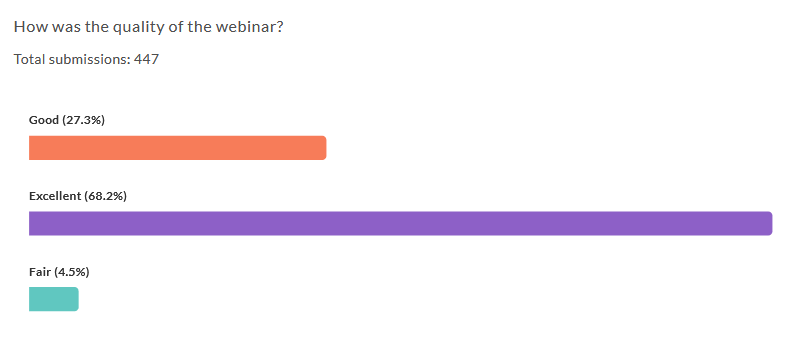
📊 Poll & Survey Data Visualisation
Get real-time feedback with in-session polls and post-event surveys, automatically collected and visualised. Export everything to share with your team or use it to guide content strategy for future events.
🔁 CRM & Automation Integration Reporting
streamGo connects seamlessly with:
Your CRM will reflect not only who registered and attended, but how long they watched and how engaged they were. Ideal for lead scoring and nurturing workflows. You can even trigger custom workflows by pushing registrations, questions and poll submissions in real-time to thousands of other apps, thanks to the streamGo Zapier integration.
✉️ Email Campaign Tracking
Every invite, reminder, and follow-up email can be tracked for:
Open and click-through rates
Auto-registration link usage
Conversion from email to attendee
Identify your most effective messages and refine your promotional strategy with every event.
▶️ Interactive Video Audience Reporting
streamGo also offers an interactive video player, providing visibility on exactly who was watching at any specific point of your live event. Including a point in time view of your audiences reactions. ❤️
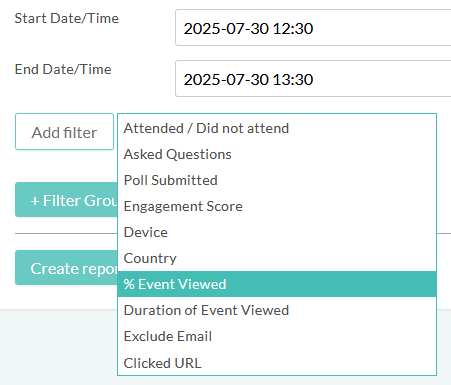
⚙️ Custom Report Building
As if all of the above wasn't enough, streamGo even provides a custom report builder! This means you can build CSV exports and get the data you need, using your own customised and most valuable KPI's.
Why This Matters
✅ Measure What Really Matters: Track engagement, not just eyeballs.
✅ Get Results Faster: Real-time dashboards and AI-generated summaries save hours.
✅ Connect the Dots: Sync all your data to your CRM and see the full picture.
✅ Prove ROI: Arm your team with the data they need to show impact and improve.
In short: You can’t improve what you don’t measure. And with streamGo, you’re measuring the metrics that matter most.
Tips to Maximise Reporting Value
To get the most out of your data:
Define your KPIs before the event. What are you trying to learn?
Use chapters and interactions to guide future topics and formats
Set up CRM workflows that trigger based on real engagement, not just sign-ups
Don’t ignore the quiet attendees, see where they dropped off and why
Smarter Events Start With Smarter Reporting
Your events are a marketing engine. And the better you understand your audience, the better you can serve them. With streamGo’s reporting suite, you’re not just collecting data. You’re turning it into informed decisions. 🚀
Inspired for your next online event?
See the streamGo platform in action!


